


According to the latest data from the ship valuation platform VesselsValue, asset ratios and ownership structures have shifted significantly over the past twelve months, from China’s continued dominant position to Taiwan reaching the “top 10” for the first time.
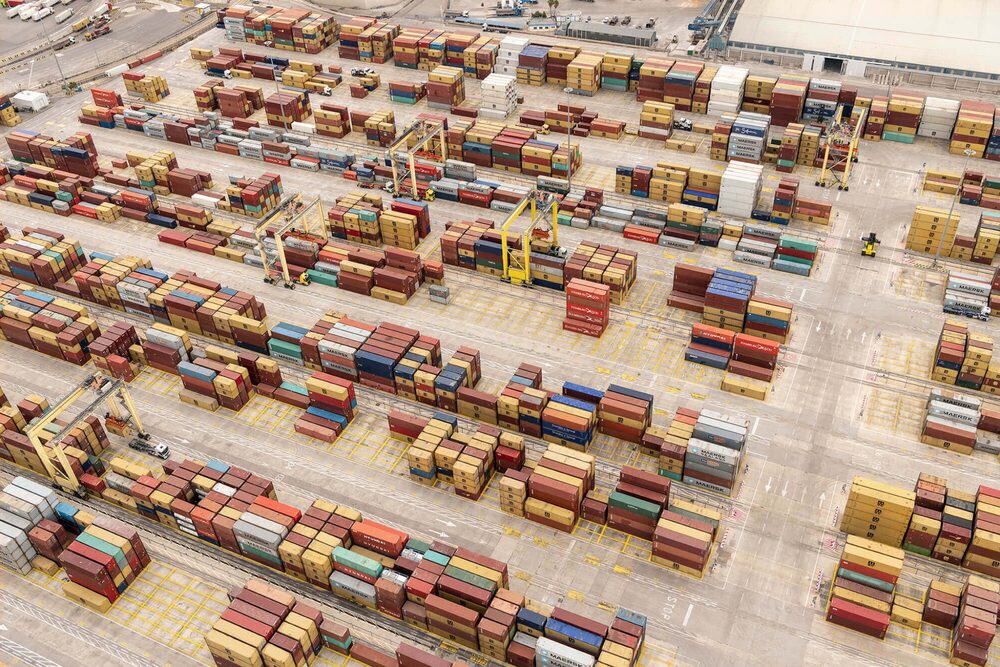
In January, the global ranking of ship-owning nations presents a clear picture of the balance of power in international shipping. China remains at the top of the list, taking the undisputed first place in terms of both fleet value and number of ships. With a total value of around $291 billion and 9,375 ships, the Chinese fleet recorded growth of around 14% compared to the previous year.
China is particularly strong in the bulker, container and small dry segments, whose asset values rose significantly over the course of the year. Ten-year-old capesize bulkers achieved price increases of over 26%, the highest values since 2008. Older container ships also increased noticeably. In addition, China has the world’s largest tanker fleet with more than 2,000 units and a total value of around $56 billion.
Japan remains at the previous year’s level
Japan follows in second place with a fleet value of $233 billion, remaining almost at the same level as the previous year. The country occupies a special position as it has the leading fleets in terms of both value and volume in the LNG, LPG, reefer and vehicle transporter segments. This specialization underlines Japan’s strategic importance in energy and vehicle transport as well as in temperature-controlled maritime transport.
Greek tanker fleet remains the measure of all things
Greece once again maintains third place and remains one of the most influential shipping nations in the world. Although China has more tankers, the Greek tanker fleet is significantly more valuable at $77 billion and outstrips China in this segment by $21 billion. Greece also has the second largest bulker fleet in the world with over 2,500 ships, but is behind Japan in terms of value.
USA makes massive gains in the cruise segment
The United States remains in fourth place and increased the total value of its fleet by more than $25 billion to $141 billion. The main driver of this growth is the cruise sector, which increased in value by around 34% to $79 billion. This underlines the USA’s global dominance in this market. It also has the most valuable fleets in several offshore and specialty segments such as MODU, OCV, OSV and RoRo.
In fifth place is Singapore, which has also increased its fleet value by more than $34 billion to $141 billion. With 3,359 ships, the country ranks fourth worldwide in terms of the number of units. Singapore is particularly strongly positioned in the LPG, OCV and OSV segments, in each of which it has one of the most valuable fleets in the world.
MSC moves Switzerland up to 6th place
Switzerland moves up to sixth place and records a fleet value of $83 billion, which corresponds to an increase of around 22% compared to the previous year. The main reason for this is the expansion strategy of the Swiss-based shipping company MSC, which has significantly expanded its container fleet through the acquisition of numerous second-hand ships as well as extensive new orders. Most of the units ordered belong to the large ULCV and New Panamax classes and are scheduled for delivery between 2027 and 2030.
New in the top 10 is Hong Kong, which ranks seventh with a fleet value of USD 78 billion. The fleet is broadly diversified, with container ships accounting for the largest share, followed by bulkers and tankers. Hong Kong is also well positioned internationally in the LNG segment, ranking fifth worldwide.
South Korea falls down the rankings
South Korea falls two places to eighth place, but keeps the total value of its fleet stable at $69 billion. Long-term investments in the LNG sector continue to pay off, even if the value of this segment has recently fallen slightly. In addition, South Korea remains a major player in vehicle transportation. Recent tanker takeovers could further increase the value of the fleet in the future, but without significantly changing the current ranking.
German container fleet in top position
Germany improves by one place and benefits above all from its traditionally strong position in the container segment. With 586 container ships, the country ranks second worldwide in terms of volume. In terms of value, however, it is only in sixth place, as the total value of the German container fleet is around 29 billion dollars.
Taiwan in the top 10 for the first time
Tenth place was taken by Taiwan, which entered the top 10 for the first time, displacing established shipping nations. With a fleet value of $63 billion and 1,297 ships, Taiwan is characterized by a comparatively modern container fleet. In 2025 alone, 63 new container ships were ordered, the majority of them by Evergreen Marine. The newbuilds are being built at South Korean and Chinese shipyards and are scheduled for delivery between 2027 and 2029.
| Rank | Country | Total value (USD million) |
|---|
| 1 | China | 291.158 |
| 2 | Japan | 231.838 |
| 3 | Greece | 199.956 |
| 4 | USA | 141.475 |
| 5 | Singapore | 118.376 |
| 6 | Switzerland | 83.293 |
| 7 | Hong Kong, China | 78.438 |
| 8 | South Korea | 69.328 |
| 9 | Germany | 65.743 |
| 10 | Taiwan, China | 62.867 |
(© Source: VesselsValue )
| Segment | China | Japan | Greece | USA | Singapore | Switzerland | Hong Kong, China | South Korea | Germany | Taiwan, China |
|---|---|---|---|---|---|---|---|---|---|---|
| Bulker | 83.800 | 67.698 | 56.441 | 4.284 | 23.090 | 1.921 | 15.261 | 10.926 | 8.482 | 13.564 |
| Containers | 65.880 | 41.446 | 23.723 | 5.591 | 34.571 | 47.936 | 32.540 | 19.554 | 28.665 | 45.667 |
| Cruise | 4.223 | 1.658 | 184 | 78.788 | 102 | 22.247 | 2 | 19 | 12.933 | – |
| Ferry | 2.414 | 3.069 | 1.252 | 8 | 27 | 851 | 396 | 652 | 717 | – |
| LNG | 33.911 | 34.644 | 30.242 | 5.708 | 2.604 | – | 6.937 | 13.126 | 331 | 154 |
| LPG | 10.532 | 16.875 | 6.829 | 1.437 | 16.025 | 7 | 1.929 | 3.516 | 1.343 | 18 |
| MODU | 7.517 | 564 | – | 15.932 | 2.219 | 5.934 | 657 | – | – | – |
| OCV+ | 916 | 57 | 481 | 2.934 | 1.220 | 374 | 73 | – | 136 | 259 |
| OSV | 4.025 | 128 | 1.495 | 12.047 | 4.700 | 222 | 301 | 35 | 131 | 107 |
| Reefer | 311 | 1.533 | 228 | 155 | 300 | – | 66 | 345 | 123 | 113 |
| Renewable* | 74 | 43 | – | 182 | 43 | – | 3 | 9 | 153 | 95 |
| Ro-Ro | 162 | 1.946 | 72 | 2.814 | 36 | 47 | 56 | 168 | 101 | 14 |
| Small Dry | 14.966 | 9.389 | 492 | 358 | 2.107 | 420 | 3.260 | 1.672 | 7.491 | 637 |
| Tankers | 56.017 | 38.296 | 77.418 | 10.471 | 28.916 | 2.798 | 13.731 | 13.265 | 5.002 | 2.228 |
| Vehicle carriers | 6.411 | 14.492 | 1.098 | 767 | 2.416 | 537 | 3.227 | 6.040 | 135 | 10 |
(© Source: VesselsValue )